Using the dashboard
The Dashboard has two sections:
Tip
Each dashboard section can be collapsed/expanded by clicking the section header.
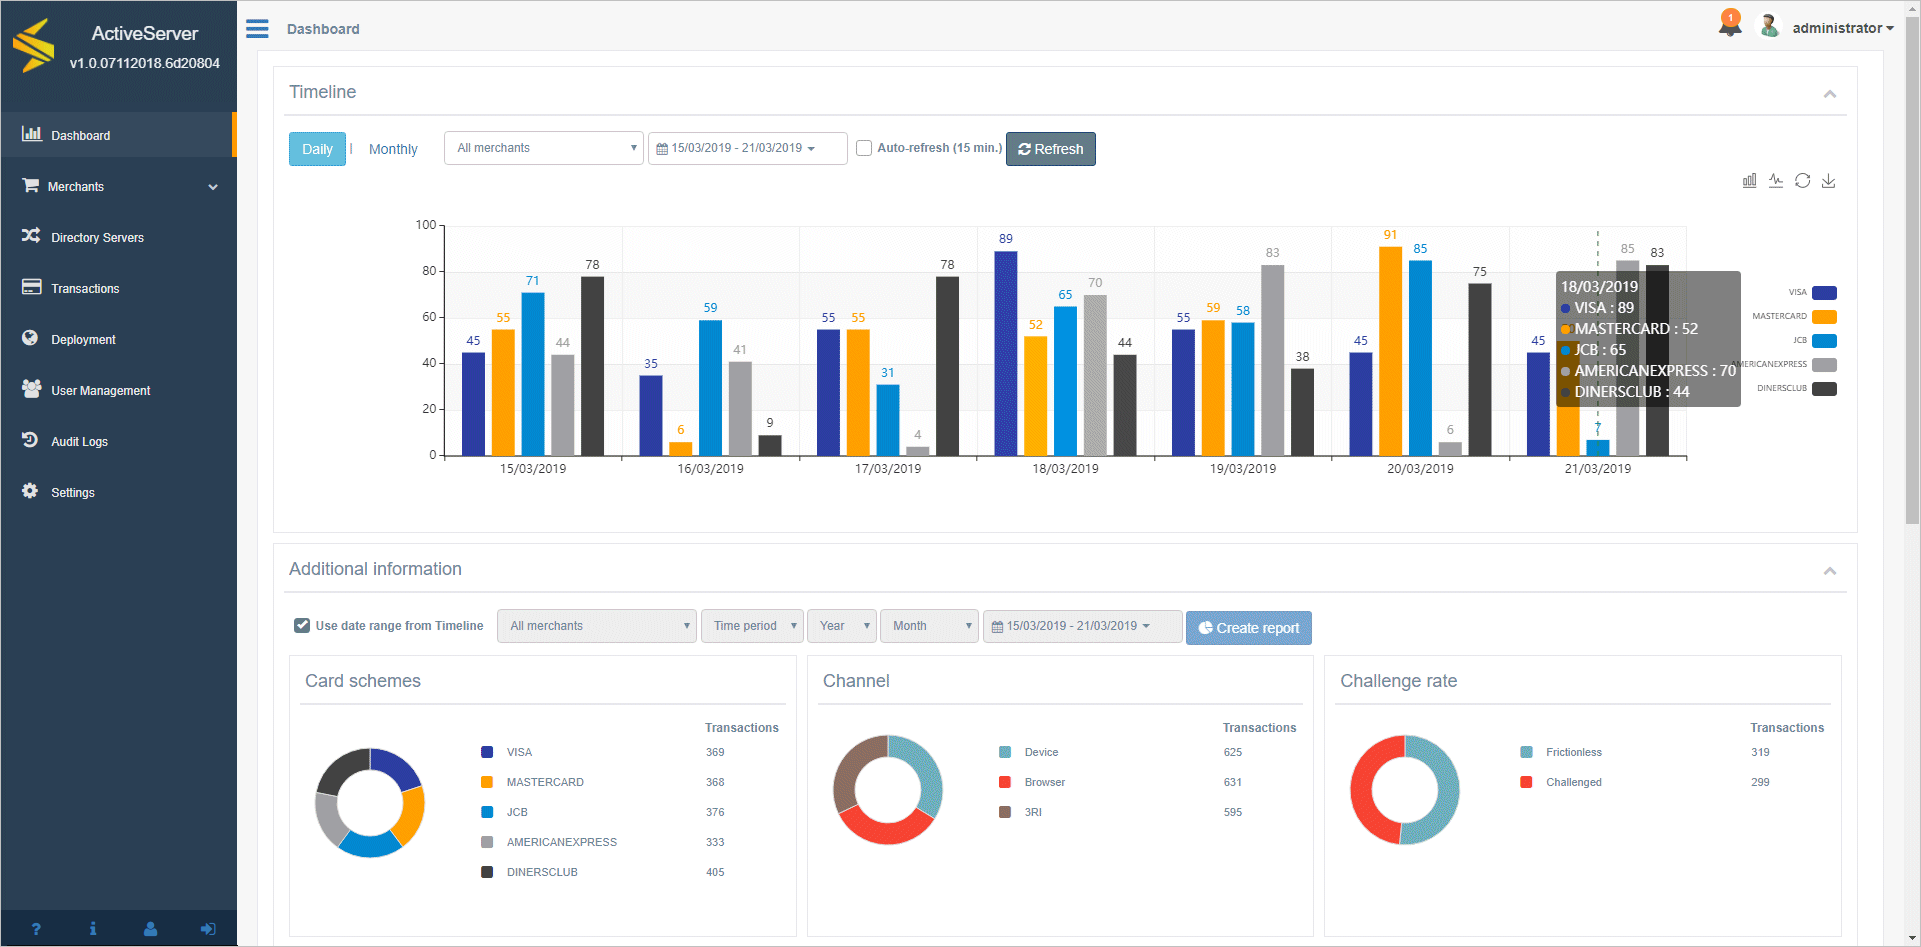
Timeline
The Timeline provides an historical, graphical breakdown of the number of transactions performed during a specified time period, and is separated by card scheme. Each card scheme view can be toggled off by clicking its icon on the right hand side of the graph. The graph is available in both line and bar chart format, which can be toggled between using the relevant buttons in the top right hand corner of the chart.
The interface can be set to update every 15 minutes by choosing the Auto-refresh option. The Refresh button can be used to refresh the data on the screen to the most recently collected data.
The data can be shown as either a Daily or Monthly view, indicating what the column values represent.
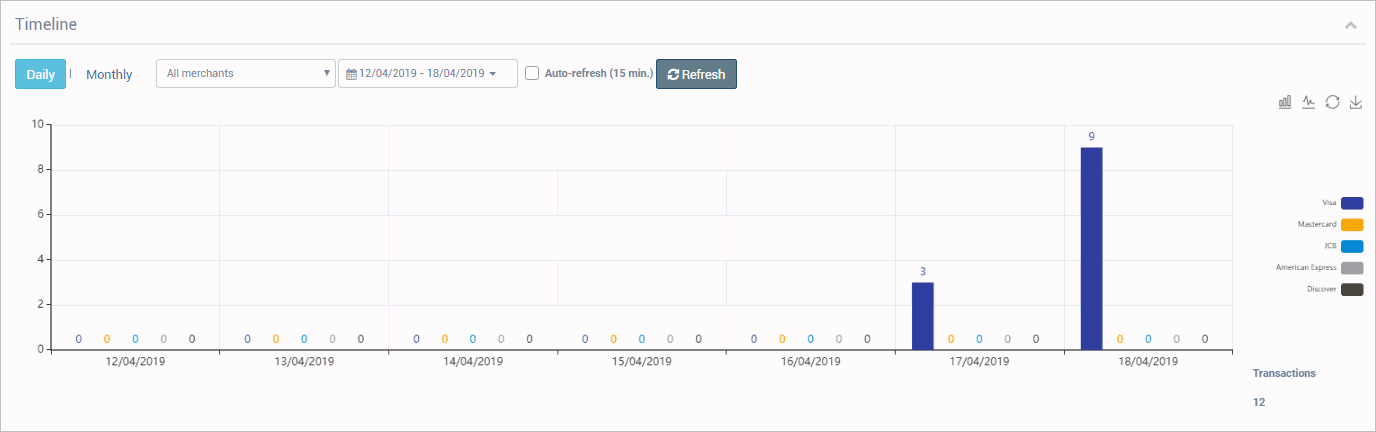
Daily
When the Daily view is selected, each column on the graph represents one calendar day in DD/MM/YYYY format. The Daily view comes with pre-selectable date ranges for quick viewing:
Last 7 days- previous 7 calendar days, including current day.Last 30 days- last 30 calendar days, including current day.Current month- all days in the current calendar month, including current day.Last month- all days in the last calendar month.
You can also select a custom date range using the date range picker. This custom date range can be a minimum of 1 day and maximum of 31 days.
Monthly
When the Monthly view is selected, each column on the graph represents one calendar month in MM/YYYY format. The Monthly view comes with pre-selectable date ranges for quick viewing:
Current month- current calendar month, including current day.Current year- current calendar year, including current day.Last month- previous calendar month.Last year- previous calendar year.
You can also select a custom date range using the date range picker. This custom date range can be a minimum of 1 month and maximum of 12 months.
Additional information
The Additional information section of the dashboard gives a deeper level of insight into the final status of each transaction performed in ActiveServer. This information can be used to supplement the information shown in the Timeline section or to view transaction statistics for any historical date range for the system.
Time periods
If Use date range from Timeline is selected, date range and merchant selection options will be greyed out and the options chosen in the Timeline section will be used to show a synchronised view across both sections.
If Use date range from Timeline is not selected, the user will be able to specify which merchant statistics should be shown, along with the following time periods:
Year- calendar year period.Month- calendar month period, in a specific year.Custom- specific date range for custom period, selected from pre-set options:Current month- current calendar month, including current day.Current year- current calendar year, including current day.Last month- previous calendar month.Last year- previous calendar year.Custom- any custom period.
Graphs
Each graph shows a different subsection of data for a transaction.
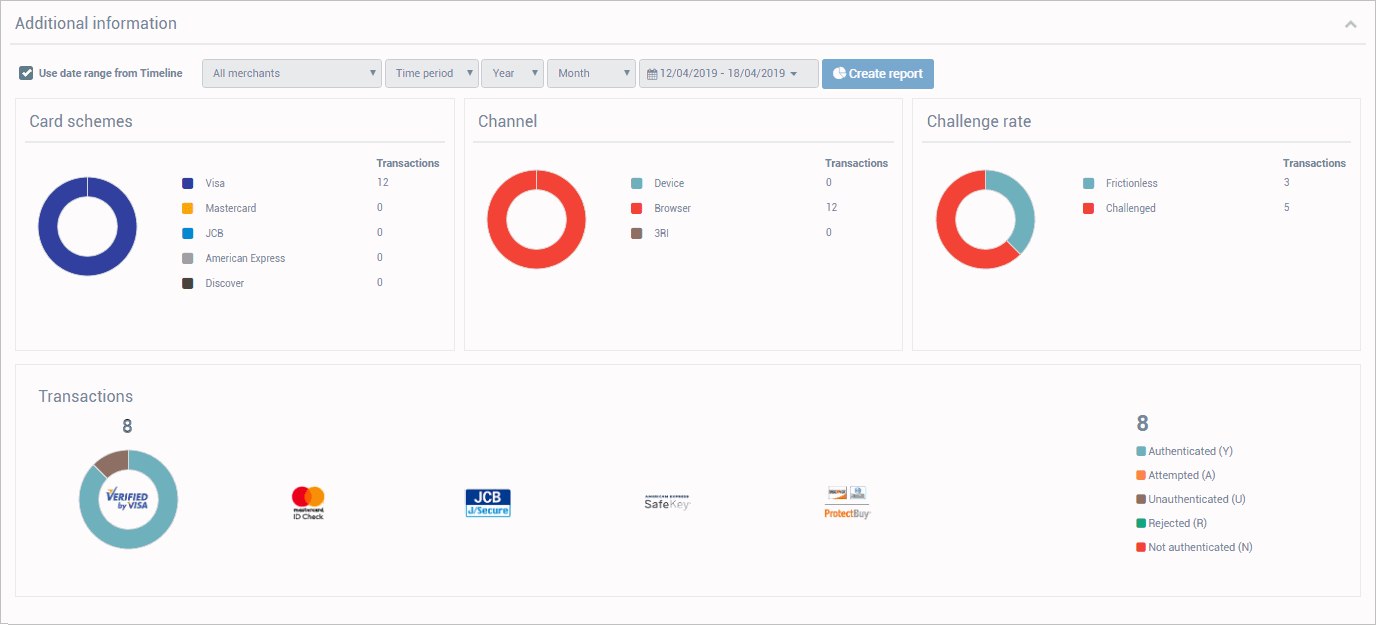
Card schemes
The Card schemes section gives a numerical breakdown of total transactions per card scheme in the Transaction column.
Hover over the graph for a percentage breakdown of the total transactions per card scheme.
Channel
The Channel section gives a numerical breakdown of total transactions per channel used, which can give an idea on which platform a merchant is performing most of their transactions. A Browser entry indicates that the user was authenticated using a web-based checkout process. A Device entry indicates that the user was authenticated using a native mobile app during the checkout process. A 3RI entry indicates that the merchant has performed 3DS Requestor Initiated authentication (e.g confirming account validity or decoupled transaction).
The transactions totals are displayed in the Transactions column. Hover over the graph for a percentage breakdown of the channels used.
Challenge rate
The Challenge rate section gives a numerical breakdown of total transactions based on the challenge status of transactions. A Frictionless entry indicates that the cardholder was able to be authenticated by the issuer's ACS using Risk-Based Authentication (RBA) and a step up challenge was not required. A Challenged entry indicates that the ACS requested that the cardholder authenticate themselves. This is useful for monitoring the progress of frictionless flow capabilities over time.
Transactions
The Transactions section gives a numerical breakdown of transactions and their authentication status. The column on the right hand side shows the total amount of transactions, divided into the final status response. The individual graphs show the percentage breakdown of transaction status's per card scheme. Authentication status's are described as the following: The Transactions section gives a numerical breakdown of transactions and their authentication status. The column on the right hand side shows the total amount of authentications, divided into the final status response. The individual graphs show the percentage breakdown of transaction status per card scheme. Authentication status is described as follows:
- Authenticated (Y) - Authentication verification successful.
- Attempted (A) - Attempts processing performed; Not authenticated/verified but a proof of attempted authentication/verification is provided.
- Unauthenticated (U) - Authentication/account verification could not be performed; technical or other problem.
- Rejected (R) - Authentication/account verification rejected; Issuer is rejecting transaction/verification and requests that authorisation not be attempted.
- Not Authenticated (N) - Not authenticated/account not verified; transaction denied.